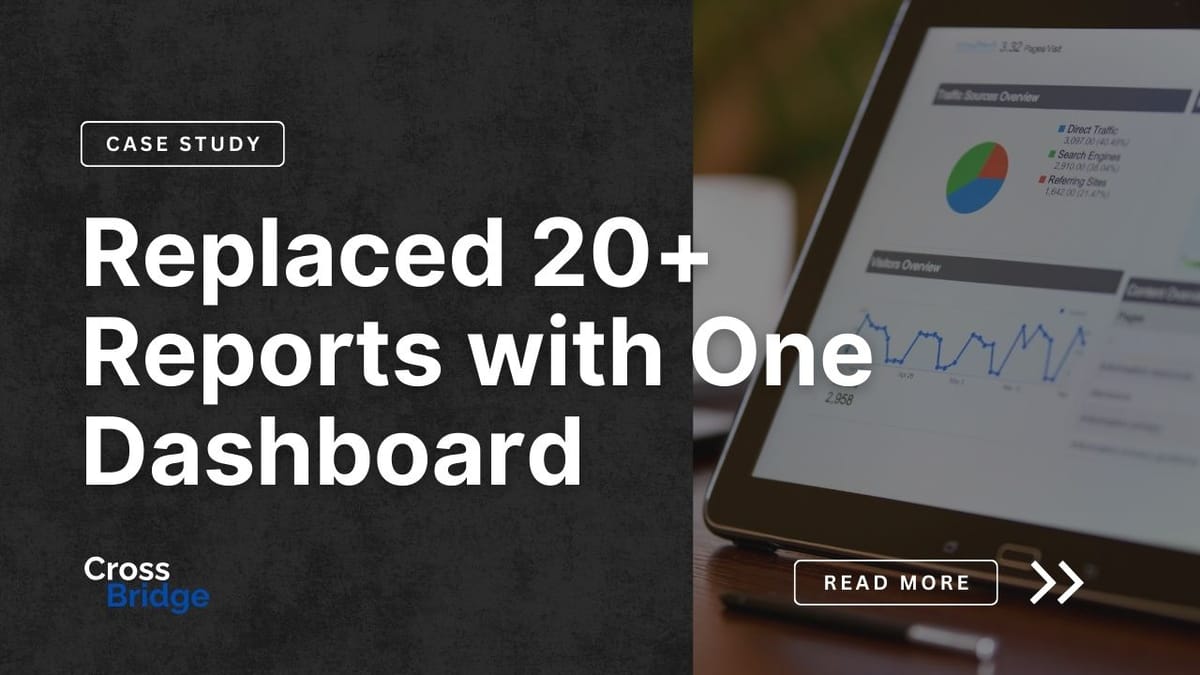
How We Replaced 20+ Excel Reports With One Real-Time Dashboard
Every team had a different spreadsheet. Sales. Finance. Logistics. No one fully trusted the data, and decisions lagged behind reality. We built a real-time dashboard that brought it all together.
About our Clients
We work with suppliers global suppliers who sell to major retailers like Walmart, Target, and Home Depot. These companies manage complex operations—container logistics, inventory planning, sales reconciliation, and forecasting—all while responding to shifting retail demands.
What they all had in common was a growing problem:
Too much data. In too many spreadsheets. Owned by too many people.
The Problem
Before our Analytics dashboard, most suppliers were stuck in a familiar pattern:
- Multiple versions of the same report floating between inboxes
- Forecasts built in isolation—sales, supply chain, and finance all using different timelines and assumptions
- No shared system of record for sales, inventory, or container tracking
- Reports arriving late, out of sync, or lost in email threads
- And worst of all: decisions made based on outdated or incomplete data
Everyone had their own version of the truth—and no one trusted it fully.
The Solution: CrossBridge Analytics
To solve this, we created CrossBridge Analytics—a centralized, cloud-based platform that eliminates data silos and replaces static spreadsheets with dynamic, real-time dashboards.
The platform integrates directly with our ERP layer, ensuring that every number reflects what’s actually happening—right now.
Key Features Include:
- Live ERP sync
Always-updated reports—no more waiting for someone to “pull the latest numbers”
- Dynamic, filterable dashboards
View performance by customer, retailer, SKU, warehouse, or date range—on demand
- Universal access
Works on any device, from desktop to mobile. Access insights from anywhere.
- Consolidated reporting
Sales, inventory, inbound containers, forecasting, and financials—all visualized in one place
- Zero emails
No more attachments, outdated files, or chasing reports buried in someone’s inbox
We didn’t just build a tool—we built a clear, single source of truth for every team inside the business.
Results
For our clients, the difference was immediate:
- Faster, better decisions
Real-time visibility means leadership can act in the moment, not after the fact
- Alignment across teams
Everyone—from sales to logistics to finance—is working off the same data
- Time saved across the board
Less time digging for answers, more time solving problems
One client summed it up perfectly:
“I used to spend 20 minutes just finding the latest sales report. Now I get the answer in 2 clicks on my phone.”
What used to feel like chaos is now a clear, shared operating picture.
Key Takeaway
CrossBridge Analytics replaced the mess of Excel attachments with a unified, real-time, mobile-friendly platform—turning scattered data into actionable insight for clients.